Question
You are profiling data by using Power Query Editor.
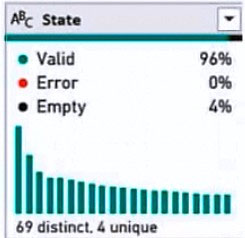
You have a table named Reports that contains a column named State. The distribution and quality data metrics for the data in State is shown in the following exhibit.
Use the drop-down menus to select the answer choice that completes each statement based on the information presented in the graphic.
Explanation
Different values including nulls: column distribution reports 69 distinct values, and the distinct count includes null (empty) as one of the values, so the answer is 69. Non-null values that occur only once: the unique count is 4, meaning 4 values appear exactly once; empty accounts for 4% of the rows, so null occurs many times and is not one of the unique values. 65 and 73 come from wrongly subtracting or adding the unique count.
