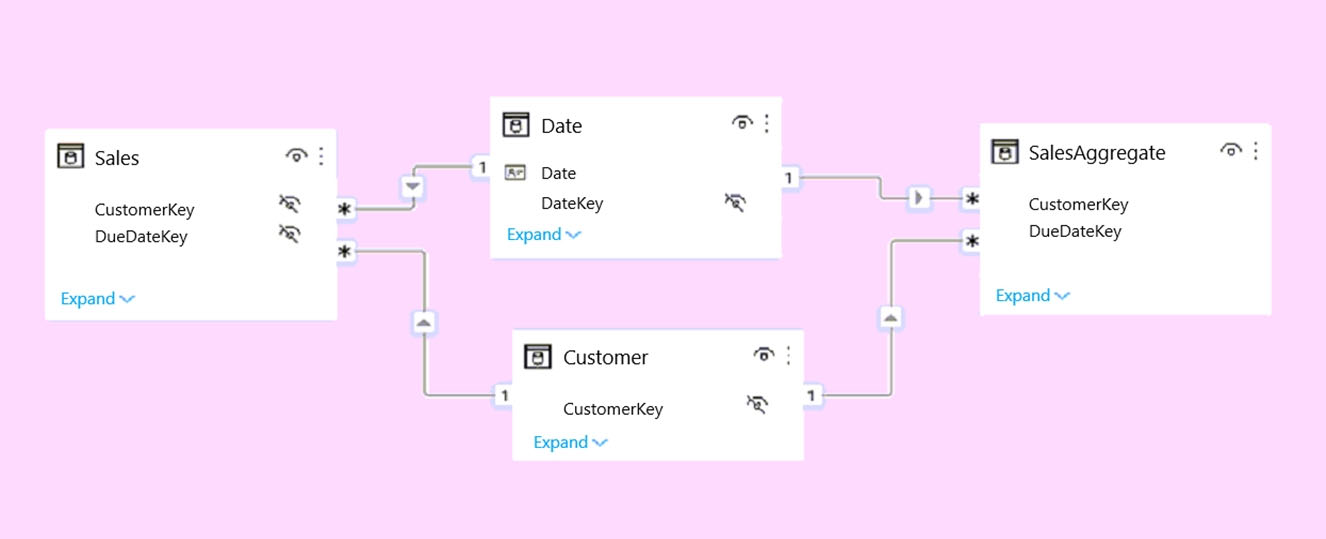
You plan to create the Power BI model shown in the exhibit.
The data has the following refresh requirements:
- Customer must be refreshed daily.
- Date must be refreshed once every three years.
- Sales must be refreshed in near real time.
- SalesAggregate must be refreshed once per week.
You need to select the storage modes for the tables. The solution must meet the following requirements:
- Minimize the load times of visuals.
- Ensure that the data is loaded to the model based on the refresh requirements.
Which storage mode should you select for each table?
Explanation
Sales must be near real time, so it must use DirectQuery; an imported copy would only be as fresh as the last refresh. SalesAggregate is refreshed only weekly and holds summarized data, so Import caches it in memory for the fastest visuals. Customer and Date are dimension tables related both to the DirectQuery Sales table and to the imported SalesAggregate table. Setting them to Dual lets Power BI answer queries from the cache when they join to SalesAggregate and push them to the source when they join to Sales, which keeps the relationships regular and avoids the limited relationships that Import or DirectQuery dimensions would create.
You have a project management app that is fully hosted in Microsoft Teams. The app was developed by using Microsoft Power Apps.
You need to create a Power BI report that connects to the project management app.
Which connector should you select?
A.Microsoft Teams Personal Analytics
B.SQL Server database
C.DataverseCorrect
D.Dataflows
Explanation
Power Apps built inside Microsoft Teams store their data in Dataverse for Teams, so the Dataverse connector in Power BI Desktop is the way to reach that data. Microsoft Teams Personal Analytics reports on a user's Teams activity, not app data. The app has no SQL Server database you can connect to, and dataflows are Power BI artifacts rather than the app's data store.
For the sales department at your company, you publish a Power BI report that imports data from a Microsoft Excel file located in a Microsoft SharePoint folder.
The data model contains several measures.
You need to create a Power BI report from the existing data. The solution must minimize development effort.
Which type of data source should you use?
A.Power BI datasetCorrect
B.a SharePoint folder
C.Power BI dataflows
D.an Excel workbook
Explanation
The published report already has a dataset (semantic model) containing the data and the measures. Connecting a new report to that Power BI dataset reuses everything without rebuilding anything. Connecting again to the SharePoint folder or the Excel workbook would require recreating the transformations and measures, and no dataflow exists for this data.
You import two Microsoft Excel tables named Customer and Address into Power Query. Customer contains the following columns:
- Customer ID
- Customer Name
- Phone
- Email Address
- Address ID
Address contains the following columns:
- Address ID
- Address Line 1
- Address Line 2
- City
- State/Region
- Country
- Postal Code
Each Customer ID represents a unique customer in the Customer table. Each Address ID represents a unique address in the Address table.
You need to create a query that has one row per customer. Each row must contain City, State/Region, and Country for each customer.
What should you do?
A.Merge the Customer and Address tables.Correct
B.Group the Customer and Address tables by the Address ID column.
C.Transpose the Customer and Address tables.
D.Append the Customer and Address tables.
Explanation
A merge joins Customer to Address on Address ID, keeping one row per customer and letting you expand City, State/Region, and Country into it. Appending stacks rows from both tables instead of adding columns. Grouping aggregates rows, and transposing swaps rows and columns, so neither combines the two tables.
You have two Azure SQL databases that contain the same tables and columns.
For each database, you create a query that retrieves data from a table named Customer.
You need to combine the Customer tables into a single table. The solution must minimize the size of the data model and support scheduled refresh in powerbi.com.
What should you do?
Explanation
Option to use to combine the Customer tables: the tables have the same columns, so their rows must be stacked with an append, not joined with a merge. Append Queries as New creates a separate combined query while leaving both source queries intact. Action to perform on the original two SQL database queries: disable loading them to the data model so only the combined table is stored, which minimizes model size. They still run during refresh because the combined query depends on them; deleting them would break the append, and excluding them from report refresh would stop the combined table from getting new data.
In Power Query Editor, you have three queries named ProductCategory, ProductSubCategory, and Product.
Every Product has a ProductSubCategory.
Not every ProductSubCategory has a parent ProductCategory.
You need to merge the three queries into a single query. The solution must ensure the best performance in Power Query.
How should you merge the tables? Each join kind may be used once, more than once, or not at all.
Explanation
Every product has a subcategory, so an inner join between Product and ProductSubCategory keeps every product and is the cheapest join to evaluate. Not every subcategory has a parent category, so ProductSubCategory must be joined to ProductCategory with a left outer join; an inner join there would drop subcategories without a category and the products in them. Full outer and right joins would add category rows with no products, and anti joins return only non-matching rows.
You have a Microsoft SharePoint Online site that contains several document libraries.
One of the document libraries contains manufacturing reports saved as Microsoft Excel files. All the manufacturing reports have the same data structure.
You need to use Power BI Desktop to load only the manufacturing reports to a table for analysis.
What should you do?
A.Get data from a SharePoint folder and enter the site URL. Select Transform, then filter by the folder path to the manufacturing reports library.Correct
B.Get data from a SharePoint list and enter the site URL. Select Combine & Transform, then filter by the folder path to the manufacturing reports library.
C.Get data from a SharePoint folder, enter the site URL, and then select Combine & Load.
D.Get data from a SharePoint list, enter the site URL, and then select Combine & Load.
Explanation
The SharePoint folder connector lists every file in all document libraries of the site. Selecting Transform lets you filter on the Folder Path column to keep only the manufacturing reports library before combining the files. Combine & Load straight away would try to combine every file on the site, not just the manufacturing reports. The SharePoint list connector reads list items, not the contents of files in a document library.
You have a Microsoft Excel workbook that contains two sheets named Sheet1 and Sheet2.
Sheet1 contains the following table named Table1.
| Products |
|---|
| abc |
| def |
| ghi |
| jkl |
| mno |
Sheet2 contains the following table named Table2.
| Products |
|---|
| abc |
| xyz |
| tuv |
| mno |
| pqr |
| stu |
You need to use Power Query Editor to combine the products from Table1 and Table2 into the following table that has one column containing no duplicate values.
| Products |
|---|
| abc |
| xyz |
| tuv |
| mno |
| pqr |
| stu |
| def |
| ghi |
| jkl |
Which three actions should you perform in sequence?
Explanation
First import both tables from the Excel workbook so they are available as queries. Then append Table2 to Table1, which stacks the rows of both tables into the single Products column. Finally, remove duplicates on the appended Table1 so values that appear in both tables, such as abc and mno, appear only once. A merge would join the tables side by side instead of stacking rows, and there are no errors to remove.
You have a CSV file that contains user complaints. The file contains a column named Logged. Logged contains the date and time each complaint occurred. The data in Logged is in the following format: 2018-12-31 at 08:59.
You need to be able to analyze the complaints by the logged date and use a built-in date hierarchy.
What should you do?
A.Apply a transformation to extract the last 11 characters of the Logged column and set the data type of the new column to Date.
B.Change the data type of the Logged column to Date.
C.Split the Logged column by using at as the delimiter.Correct
D.Apply a transformation to extract the first 11 characters of the Logged column.
Explanation
Splitting Logged on the "at" delimiter separates the date part from the time part, and Power Query detects the new date column as a Date type, which gives you the built-in date hierarchy. Changing the whole column to Date fails because the literal text "at" cannot be parsed. Extracting the first 11 characters leaves a text column with no Date type, and the last 11 characters contain the time, not the date.
You have a Microsoft Excel file in a Microsoft OneDrive folder.
The file must be imported to a Power BI dataset.
You need to ensure that the dataset can be refreshed in powerbi.com.
Which two connectors can you use to connect to the file? Each correct answer presents a complete solution.
A.Excel Workbook
B.Text/CSV
C.Folder
D.SharePoint folderCorrect
E.WebCorrect
Explanation
OneDrive for work or school is built on SharePoint Online, so the SharePoint folder connector can reach the file through the cloud and the dataset refreshes in the service without a gateway. The Web connector with the file's OneDrive URL also connects to the cloud copy and supports scheduled refresh. The Excel Workbook and Folder connectors point at a local or synced file path, which the service cannot reach without a gateway, and Text/CSV cannot read an Excel file.
You are profiling data by using Power Query Editor.
You have a table named Reports that contains a column named State. The distribution and quality data metrics for the data in State is shown in the following exhibit.
Use the drop-down menus to select the answer choice that completes each statement based on the information presented in the graphic.
Explanation
Different values including nulls: column distribution reports 69 distinct values, and the distinct count includes null (empty) as one of the values, so the answer is 69. Non-null values that occur only once: the unique count is 4, meaning 4 values appear exactly once; empty accounts for 4% of the rows, so null occurs many times and is not one of the unique values. 65 and 73 come from wrongly subtracting or adding the unique count.
You have two CSV files named Products and Categories.
The Products file contains the following columns:
- ProductID
- ProductName
- SupplierID
- CategoryID
The Categories file contains the following columns:
- CategoryID
- CategoryName
- CategoryDescription
From Power BI Desktop, you import the files into Power Query Editor.
You need to create a Power BI dataset that will contain a single table named Product. The Product table includes the following columns:
- ProductID
- ProductName
- SupplierID
- CategoryID
- CategoryName
- CategoryDescription
How should you combine the queries, and what should you do on the Categories query?
Explanation
Combine the queries by performing a: Merge, joining Products to Categories on CategoryID to add CategoryName and CategoryDescription as columns. Append would stack rows rather than add columns, and transpose does not combine queries. On the Categories query: disable the query load so the dataset contains only the single Product table. Deleting the query would break the merge that depends on it, and excluding it from report refresh would leave category data stale.
You have an Azure SQL database that contains sales transactions. The database is updated frequently.
You need to generate reports from the data to detect fraudulent transactions. The data must be visible within five minutes of an update.
How should you configure the data connection?
A.Add a SQL statement.
B.Set the Command timeout in minutes setting.
C.Set Data Connectivity mode to Import.
D.Set Data Connectivity mode to DirectQuery.Correct
Explanation
DirectQuery sends queries to the Azure SQL database when visuals load, so reports show the current data within minutes of an update. Import mode only shows data as of the last scheduled refresh, which cannot run often enough to guarantee five-minute freshness. A SQL statement or the command timeout setting does not change how current the data is.
You have a folder that contains 100 CSV files.
You need to make the file metadata available as a single dataset by using Power BI. The solution must NOT store the data of the CSV files.
Which three actions should you perform in sequence?
Explanation
The Folder connector returns one row per file with metadata columns such as Name, Extension, and dates, plus a Content column holding the file data and an Attributes record. Removing the Content column ensures the CSV data itself is not stored, and expanding Attributes exposes further metadata such as file size. Combining the Content column would load the CSV data, removing Attributes would discard metadata, and the Text/CSV connector reads one file's contents rather than folder metadata.
A business intelligence (BI) developer creates a dataflow in Power BI that uses DirectQuery to access tables from an on-premises Microsoft SQL server. The Enhanced Dataflows Compute Engine is turned on for the dataflow.
You need to use the dataflow in a report. The solution must meet the following requirements:
- Minimize online processing operations.
- Minimize calculation times and render times for visuals.
- Include data from the current year, up to and including the previous day.
What should you do?
A.Create a dataflows connection that has DirectQuery mode selected.
B.Create a dataflows connection that has DirectQuery mode selected and configure a gateway connection for the dataset.
C.Create a dataflows connection that has Import mode selected and schedule a daily refresh.Correct
D.Create a dataflows connection that has Import mode selected and create a Microsoft Power Automate solution to refresh the data hourly.
Explanation
Importing the dataflow caches the data in the model, so visuals calculate and render from memory and no queries run online at report time. Data only needs to be current up to the previous day, so a daily scheduled refresh is enough. DirectQuery options send a query for every visual interaction, increasing online processing and render times, and an hourly refresh adds processing the requirement does not need.
You publish a dataset that contains data from an on-premises Microsoft SQL Server database.
The dataset must be refreshed daily.
You need to ensure that the Power BI service can connect to the database and refresh the dataset.
Which four actions should you perform in sequence? To answer, move the appropriate actions from the list of actions to the answer area and arrange them in the correct order.
Explanation
The Power BI service reaches an on-premises SQL Server only through an on-premises data gateway, so you install and configure the gateway first. Next you add the SQL Server database as a data source (connection) on that gateway, and then give the dataset owner access to that data source so the dataset can be bound to it. Finally you configure a daily scheduled refresh on the dataset. A virtual network data gateway is for Azure data services inside a virtual network, not for an on-premises server.
You attempt to connect Power BI Desktop to a Cassandra database.
From the Get Data connector list, you discover that there is no specific connector for the Cassandra database.
You need to select an alternate data connector that will connect to the database.
Which type of connector should you choose?
A.Microsoft SQL Server database
B.ODBCCorrect
C.OLE DB
D.OData
Explanation
When Power BI has no dedicated connector for a database, the generic ODBC connector can connect to any source that has an ODBC driver installed, and Cassandra ODBC drivers are widely available. The SQL Server connector only works with SQL Server, OData needs an OData web feed, and OLE DB depends on an OLE DB provider, which Cassandra does not commonly offer.
You receive annual sales data that must be included in Power BI reports.
From Power Query Editor, you connect to the Microsoft Excel source shown in the following exhibit.
| Month | MonthNumber | 2019 | 2020 | 2021 |
|---|---|---|---|---|
| Jan | 1 | 345 | 5526 | 3456 |
| Feb | 2 | 758 | 773 | 0 |
| Mar | 3 | 37763 | 570 | null |
| Apr | 4 | 8364 | 9417 | null |
| May | 5 | 58256 | 276 | null |
| June | 6 | 6722 | 235 | null |
| July | 7 | 55225 | 6297 | null |
| Aug | 8 | 673 | 63 | null |
| Sep | 9 | 552 | 357 | null |
| Oct | 10 | 7838 | 24214 | null |
| Nov | 11 | 83544 | 257 | null |
| Dec | 12 | 32455 | 389 | null |
You need to create a report that meets the following requirements:
- Visualizes the Sales value over a period of years and months
- Adds a slicer for the month
- Adds a slicer for the year
Which three actions should you perform in sequence? To answer, move the appropriate actions from the list of actions to the answer area and arrange them in the correct order.
Explanation
Each year is stored as its own column, so the data must be unpivoted to get one Year column and one Sales column. Selecting Month and MonthNumber and choosing Unpivot other columns turns every other column into Attribute/Value pairs, and it also picks up any year columns added later. Renaming Attribute to Year and Value to Sales then gives fields for the visual and both slicers. Transpose would swap rows and columns and not produce a usable year field.
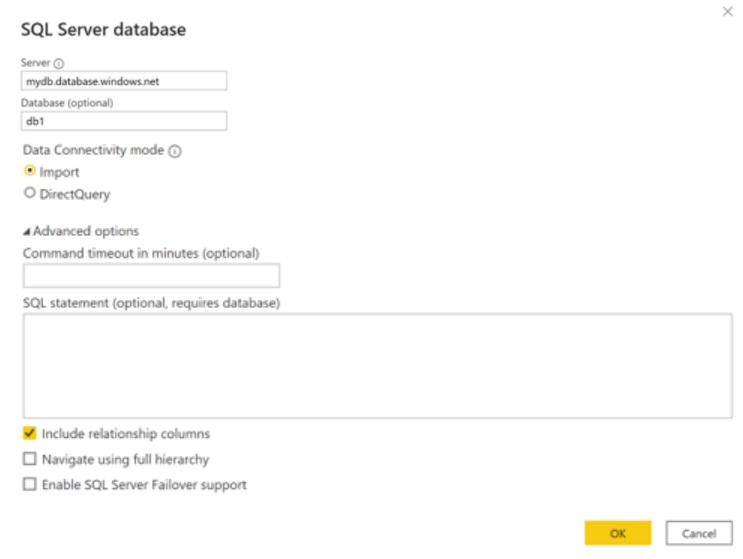
You are using Power BI Desktop to connect to an Azure SQL database.
The connection is configured as shown in the following exhibit.
Use the drop-down menus to select the answer choice that completes each statement based on the information presented in the graphic.
Explanation
Default timeout: the Command timeout in minutes box is empty, so the connector uses its default timeout of 10 minutes; the timeout is never unlimited and one minute is not the default. Navigator: Navigate using full hierarchy is cleared, and when that option is cleared the Navigator displays only the tables whose columns and rows contain data; checking it would show the complete hierarchy of tables.
You have the Azure SQL databases shown in the following table.
| Name | Stage | Server URL |
|---|---|---|
| db-powerbi-dev | Development | dev.database.windows.net |
| db-powerbi-uat | Test | uat.database.windows.net |
| db-powerbi-prod | Production | prod.database.windows.net |
You plan to build a single PBIX file to meet the following requirements:
- Data must be consumed from the database that corresponds to each stage of the development lifecycle.
- Power BI deployment pipelines must NOT be used.
- The solution must minimize administrative effort.
What should you do? To answer, select the appropriate options in the answer area.
Explanation
Create: a single Power Query parameter that identifies the stage (for example dev, uat or prod) is enough, because the server URL and the database name both follow the same naming pattern and can be built from that one value in the source step. Switching stages then means changing one parameter value, which keeps administrative effort lowest; separate parameters per server, database or stage add values that must be kept in sync. Parameter type: server names, database names and stage identifiers are strings, so the parameter is of type Text; True/False and Decimal number cannot hold these values.
Verifying access...
Access Required
You need to purchase this exam to access practice mode
Unlock a few more questions every day for 300 points you earn free on
Godlike Academy. Everything you unlock with the Daily Climb stays open for 7 days after your last unlock.