Question
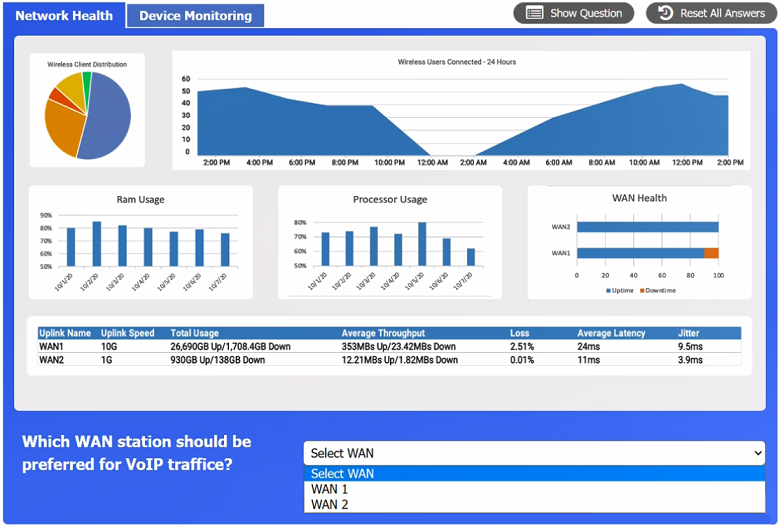
After a recent power outage, users are reporting performance issues accessing the application servers. Wireless users are also reporting intermittent Internet issues.
Review the Network Health and Device Monitoring dashboards shown in the exhibits, then answer each question.
WAN uplinks:
| Uplink Name | Uplink Speed | Total Usage | Average Throughput | Loss | Average Latency | Jitter |
|---|---|---|---|---|---|---|
| WAN1 | 10G | 26,690GB Up/1,708.4GB Down | 353MBs Up/23.42MBs Down | 2.51% | 24ms | 9.5ms |
| WAN2 | 1G | 930GB Up/138GB Down | 12.21MBs Up/1.82MBs Down | 0.01% | 11ms | 3.9ms |
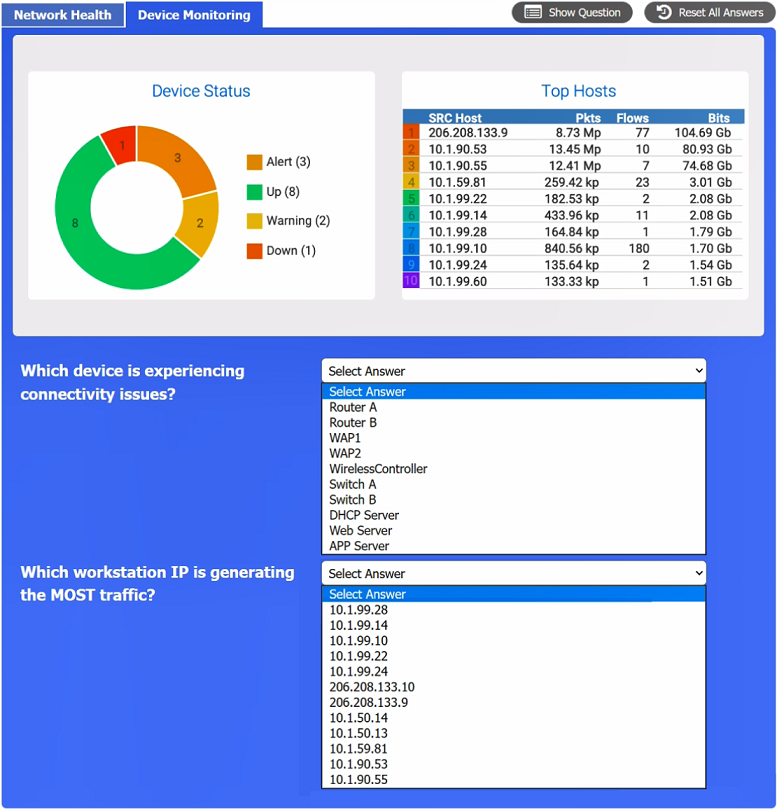
Device status:
| Device Name | IP Address | Ping Time | Total Traffic |
|---|---|---|---|
| Switch A | 10.1.99.22 | 30msec | 1Gbit/s |
| Switch B | 10.1.99.24 | 21msec | 100Mbit/s |
| WAP1 | 10.1.99.14 | 52msec | 90Mbit/s |
| WAP2 | 10.1.99.28 | 16msec | 100Mbit/s |
| Router A | 206.208.133.10 | Request timed out | 0Gbit/s |
| Router B | 206.208.133.9 | 40msec | 1Gbit/s |
| WirelessController | 10.1.99.10 | 17msec | 10Gbit/s |
Top hosts:
| # | SRC Host | Pkts | Flows | Bits |
|---|---|---|---|---|
| 1 | 206.208.133.9 | 8.73 Mp | 77 | 104.69 Gb |
| 2 | 10.1.90.53 | 13.45 Mp | 10 | 80.93 Gb |
| 3 | 10.1.90.55 | 12.41 Mp | 7 | 74.68 Gb |
| 4 | 10.1.59.81 | 259.42 kp | 23 | 3.01 Gb |
| 5 | 10.1.99.22 | 182.53 kp | 2 | 2.08 Gb |
| 6 | 10.1.99.14 | 433.96 kp | 11 | 2.08 Gb |
| 7 | 10.1.99.28 | 164.84 kp | 1 | 1.79 Gb |
| 8 | 10.1.99.10 | 840.56 kp | 180 | 1.70 Gb |
| 9 | 10.1.99.24 | 135.64 kp | 2 | 1.54 Gb |
| 10 | 10.1.99.60 | 133.33 kp | 1 | 1.51 Gb |
Explanation
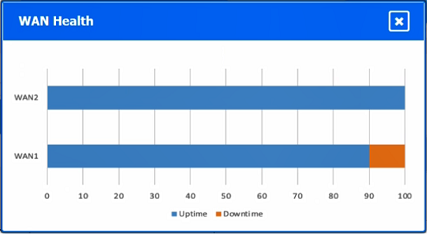
Which WAN station should be preferred for VoIP traffic: WAN 2. Voice needs low loss, latency and jitter rather than raw bandwidth; G.729 voice needs packet loss well under 1 percent and low, steady delay. WAN 2 has 0.01% loss, 11 ms latency and 3.9 ms jitter, while WAN 1 has 2.51% loss, 24 ms latency, 9.5 ms jitter and visible downtime in WAN Health. Which device is experiencing connectivity issues: Router A, the only device whose ping shows Request timed out with 0 Gbit/s of traffic, matching the single device reported Down. Which workstation IP is generating the most traffic: 10.1.90.53. In Top Hosts, 206.208.133.9 is Router B and the 10.1.99.x addresses are the switches, access points and wireless controller listed in Device Status, so the busiest end host is 10.1.90.53 with 80.93 Gb, ahead of 10.1.90.55 (74.68 Gb) and 10.1.59.81 (3.01 Gb).
