Question
You need to create a system chart for the Account entity.
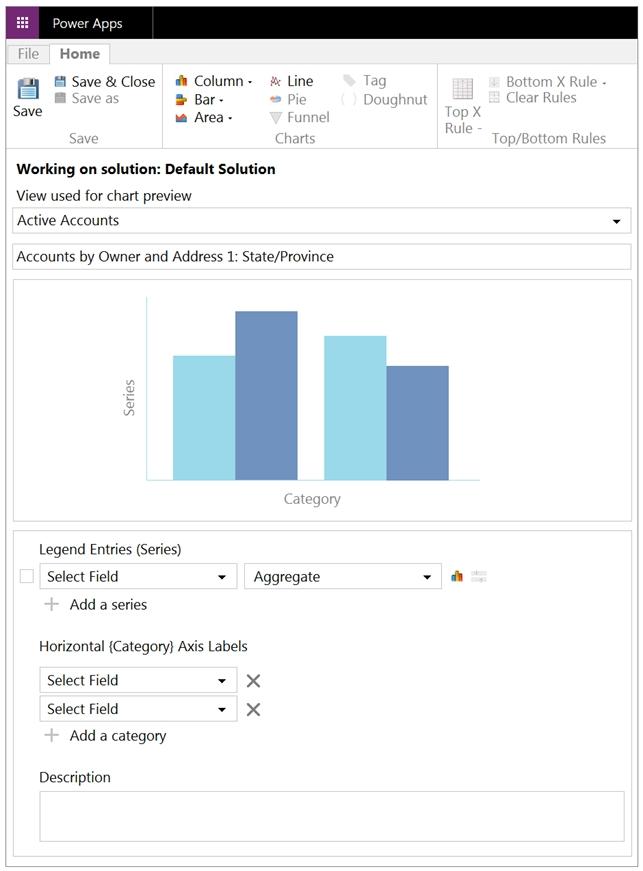
The chart must display a count of accounts grouped by owner and then display the accounts by Address 1: State/Province for each owner. You begin to configure chart options as shown in the image below.
How should you complete the configuration? To answer, select the appropriate options in the answer area.
NOTE: Each correct selection is worth one point.
Explanation
Legend Entries (Series): Select Field: Account. The series is the value the chart measures, and the requirement is a count of accounts, so the series field is the Account record itself. Owner and Address 1: State/Province are what the count is broken down by, so they belong on the category axis, not in the series.
Legend Entries (Series): Aggregate: Count:All. Count:All returns the number of Account records in each group, which is what "display a count of accounts" asks for. Sum and Avg need a numeric column such as Annual Revenue and do not count records.
First grouping field: Owner. The first field under Horizontal (Category) Axis Labels sets the main grouping, so each owner becomes a top-level group, which matches "grouped by owner."
Second grouping field: Address 1: State/Province. A second category field adds a sub-grouping inside each main group, so each owner's accounts are then shown by state or province. Repeating Owner, or choosing Account, would not give that breakdown.
