You have a Fabric warehouse that contains a table named Staging.Sales. Staging.Sales contains the following columns.
| Name | Data type | Nullable |
|---|---|---|
| ProductID | Integer | No |
| ProductName | Varchar(30) | No |
| SalesDate | Datetime2(6) | No |
| WholesalePrice | Decimal(18,2) | Yes |
| Amount | Decimal(18,2) | Yes |
You need to write a T-SQL query that will return data for the year 2023 that displays ProductID and ProductName and has a summarized Amount that is higher than 10,000.
Which query should you use?
A.SELECT ProductID, ProductName, SUM(Amount) AS TotalAmount FROM Staging.Sales WHERE DATEPART(YEAR, SalesDate) = '2023' GROUP BY ProductID, ProductName HAVING SUM(Amount) > 10000Correct
B.SELECT ProductID, ProductName, SUM(Amount) AS TotalAmount FROM Staging.Sales GROUP BY ProductID, ProductName HAVING DATEPART(YEAR, SalesDate) = '2023' AND SUM(Amount) > 10000
C.SELECT ProductID, ProductName, SUM(Amount) AS TotalAmount FROM Staging.Sales WHERE DATEPART(YEAR, SalesDate) = '2023' AND SUM(Amount) > 10000 GROUP BY ProductID, ProductName
D.SELECT ProductID, ProductName, SUM(Amount) AS TotalAmount FROM Staging.Sales WHERE DATEPART(YEAR, SalesDate) = '2023' GROUP BY ProductID, ProductName HAVING TotalAmount > 10000
Explanation
The year filter applies to individual rows, so it belongs in the WHERE clause, and the condition on the summed Amount applies to each group, so it belongs in the HAVING clause after GROUP BY. Option B fails because SalesDate is neither grouped nor aggregated, so it cannot be referenced in HAVING. Option C fails because an aggregate such as SUM cannot appear in a WHERE clause. Option D fails because T-SQL does not allow a SELECT column alias like TotalAmount to be referenced in HAVING; you must repeat SUM(Amount).
You have a data warehouse that contains a table named Stage.Customers. Stage.Customers contains all the customer record updates from a customer relationship management (CRM) system. There can be multiple updates per customer.
You need to write a T-SQL query that will return the customer ID, name, postal code, and the last updated time of the most recent row for each customer ID.
How should you complete the code? To answer, select the appropriate options in the answer area.
```sql
WITH CUSTOMERBASE AS (
SELECT [CustomerID]
,[CustomerName]
,[PostalCode]
,[LastUpdated]
,x = [Dropdown 1] OVER (PARTITION BY CustomerID
ORDER BY LastUpdated DESC)
FROM [LakehousePOC].[dbo].[CustomerChanges]
)
SELECT CustomerID, CustomerName, PostalCode, LastUpdated
FROM CUSTOMERBASE
[Dropdown 2]
```
NOTE: Each correct selection is worth one point.
Explanation
Dropdown 1: ROW_NUMBER() numbers the rows within each CustomerID partition, and because the window is ordered by LastUpdated DESC the most recent update gets number 1. LAST_VALUE() returns a value rather than a ranking, and with the default frame it does not reliably return the latest row; NTILE() splits rows into buckets, so neither identifies one row per customer. Dropdown 2: WHERE X = 1 keeps only the first-numbered row per customer, which is the most recent update. HAVING Max(LastUpdated) = 1 compares a date to 1 and has no GROUP BY, and WHERE LastUpdated = Max(LastUpdated) is invalid because aggregates are not allowed in a WHERE clause.
You are the administrator of a Fabric workspace that contains a lakehouse named Lakehouse1. Lakehouse1 contains the following tables:
- Table1: A Delta table created by using a shortcut
- Table2: An external table created by using Spark
- Table3: A managed table
You plan to connect to Lakehouse1 by using its SQL analytics endpoint.
What will you be able to do after connecting to Lakehouse1?
A.Read Table3.Correct
B.Update the data in Table3.
C.Read Table2.
D.Update the data in Table1.
Explanation
The SQL analytics endpoint gives read-only T-SQL access to the Delta tables in the lakehouse Tables area, so you can query the managed table Table3. It cannot insert, update or delete data, which rules out updating Table3 or Table1; data changes are made with Spark in the lakehouse. External tables created with Spark code are not visible to the SQL analytics endpoint, so Table2 cannot be read.
You have a Fabric tenant that contains a warehouse.
You use a dataflow to load a new dataset from OneLake to the warehouse.
You need to add a Power Query step to identify the maximum values for the numeric columns.
Which function should you include in the step?
A.Table.MaxN
B.Table.Max
C.Table.Range
D.Table.ProfileCorrect
Explanation
Table.Profile returns a profile row for every column of the table, including its minimum, maximum, average, standard deviation, count, null count and distinct count, so one step gives the maximum of each numeric column. Table.Max returns the single row with the largest value according to one comparison criterion, and Table.MaxN returns the top N rows, so neither produces a maximum per column. Table.Range just returns a range of rows by position.
You have a Fabric tenant that contains a semantic model. The model contains data about retail stores.
You need to write a DAX query that will be executed by using the XMLA endpoint. The query must return a table of stores that have opened since December 1, 2023.
How should you complete the DAX expression? To answer, drag the appropriate values to the correct targets. Each value may be used once, more than once, or not at all.
```
[Target 1]
VAR _SalesSince =
DATE ( 2023, 12, 01 )
[Target 2]
FILTER (
[Target 3] ( Store, Store[Name], Store[OpenDate] ),
Store[OpenDate] >= _SalesSince
)
```
Explanation
A DAX query that declares query-scoped variables starts with DEFINE, which holds the VAR _SalesSince definition. The table to return is produced by an EVALUATE statement, so EVALUATE goes before FILTER; without it the query returns nothing. Inside FILTER, SUMMARIZE (Store, Store[Name], Store[OpenDate]) builds a table of distinct store names and open dates, which FILTER then restricts to stores opened on or after December 1, 2023. FILTER cannot take a table plus column list in that form, and TABLE is not a DAX function that groups columns.
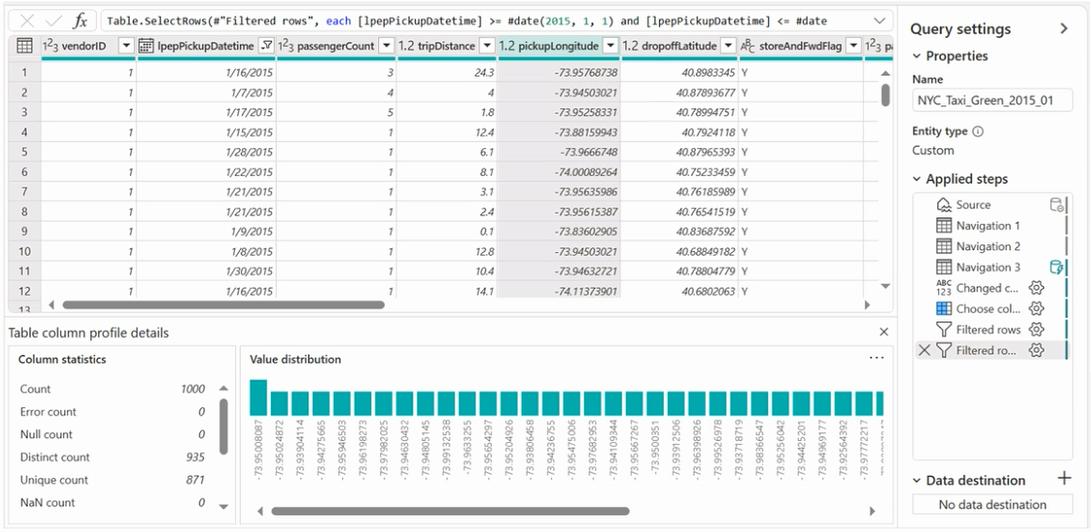
You have a Fabric workspace named Workspace1 that contains a dataflow named Dataflow1. Dataflow1 has a query that returns 2,000 rows.
You view the query in Power Query as shown in the following exhibit.
What can you identify about the pickupLongitude column?
A.The column has duplicate values.Correct
B.All the table rows are profiled.
C.The column has missing values.
D.There are 935 values that occur only once.
Explanation
The column statistics show a Count of 1000 but a Distinct count of 935 and a Unique count of 871, so some values appear more than once and the column has duplicates. Only 1,000 of the query's 2,000 rows were profiled, because column profiling is based on the top 1,000 rows by default, so not all rows are profiled. Null count, Error count and NaN count are all 0, so there are no missing values. Values that occur only once are the Unique count (871), not the Distinct count (935).
You have a Fabric tenant named Tenant1 that contains a workspace named WS1. WS1 uses a capacity named C1 and contains a semantic model named DS1.
You need to ensure read-write access to DS1 is available by using the XMLA endpoint.
What should be modified first?
A.the DS1 settings
B.the WS1 settings
C.the C1 settingsCorrect
D.the Tenant1 settings
Explanation
The XMLA endpoint is read-only by default, and read-write is enabled in the capacity's workload settings (XMLA Endpoint set to Read Write), which applies to all workspaces and semantic models on that capacity. The tenant setting that allows XMLA endpoints is already enabled by default, so it is not the first thing to change. There is no XMLA read-write setting at the workspace or semantic model level.
You have a Fabric tenant that contains a workspace named Workspace1. Workspace1 is assigned to a Fabric capacity.
You need to recommend a solution to provide users with the ability to create and publish custom Direct Lake semantic models by using external tools. The solution must follow the principle of least privilege.
Which three actions in the Fabric Admin portal should you include in the recommendation? Each correct answer presents part of the solution.
A.From the Tenant settings, set Allow XMLA Endpoints and Analyze in Excel with on-premises datasets to Enabled.Correct
B.From the Tenant settings, set Allow Azure Active Directory guest users to access Microsoft Fabric to Enabled.
C.From the Tenant settings, select Users can edit data model in the Power BI service.
D.From the Capacity settings, set XMLA Endpoint to Read Write.Correct
E.From the Tenant settings, set Users can create Fabric items to Enabled.Correct
F.From the Tenant settings, enable Publish to Web.
Explanation
External tools such as Tabular Editor create and publish semantic models through the XMLA endpoint, so the tenant setting that allows XMLA endpoints must be enabled and the capacity's XMLA Endpoint must be set to Read Write. Direct Lake semantic models are Fabric items, so users also need the Users can create Fabric items tenant setting. Guest access and Publish to Web are unrelated and would grant unnecessary access, and editing data models in the Power BI service is about web modeling, not external tools.
You are creating a semantic model in Microsoft Power BI Desktop.
You plan to make bulk changes to the model by using the Tabular Model Definition Language (TMDL) extension for Microsoft Visual Studio Code.
You need to save the semantic model to a file.
Which file format should you use?
A.PBIPCorrect
B.PBIX
C.PBIT
D.PBIDS
Explanation
Saving as a Power BI Project (PBIP) writes the semantic model definition as text files in a folder, and with the TMDL format the model is stored as .tmdl files that the TMDL extension for Visual Studio Code can open and edit in bulk. PBIX and PBIT are single binary packages that cannot be edited as TMDL text. PBIDS is only a data source connection file and contains no model.
You have a Fabric tenant that contains a warehouse named Warehouse1. Warehouse1 contains three schemas named schemaA, schemaB, and schemaC.
You need to ensure that a user named User1 can truncate tables in schemaA only.
How should you complete the T-SQL statement? To answer, select the appropriate options in the answer area.
```
GRANT [Permission] ON [Securable] TO User1;
```
Explanation
For the Permission dropdown, choose ALTER: the minimum permission required for TRUNCATE TABLE is ALTER on the table, while CONNECT only allows connecting to the database and EXECUTE applies to procedures and functions. For the Securable dropdown, choose SCHEMA::schemaA: granting ALTER at the schema scope covers every table in schemaA and nothing in schemaB or schemaC. DATABASE:: would require a database name and would cover all schemas, and OBJECT:: refers to a single table or other object, not a schema.
You plan to deploy Microsoft Power BI items by using Fabric deployment pipelines. You have a deployment pipeline that contains three stages named Development, Test, and Production. A workspace is assigned to each stage.
You need to provide Power BI developers with access to the pipeline. The solution must meet the following requirements:
- Ensure that the developers can deploy items to the workspaces for Development and Test.
- Prevent the developers from deploying items to the workspace for Production.
- Follow the principle of least privilege.
Which three levels of access should you assign to the developers? Each correct answer presents part of the solution.
A.Build permission to the production semantic models
B.Admin access to the deployment pipelineCorrect
C.Viewer access to the Development and Test workspaces
D.Viewer access to the Production workspaceCorrect
E.Contributor access to the Development and Test workspacesCorrect
F.Contributor access to the Production workspace
Explanation
Pipeline admin is the only deployment pipeline permission and is required for every pipeline operation, including deploying. Deploying items requires at least the Contributor role in both the source and target workspaces, so Contributor on Development and Test lets developers deploy between them. Viewer on Production lets them see that stage but not deploy to it, because the target workspace needs Contributor or higher. Viewer on Development and Test would block deployment, Contributor on Production would allow it, and Build permission is not a deployment permission.
You have a Fabric workspace that contains a DirectQuery semantic model. The model queries a data source that has 500 million rows.
You have a Microsoft Power BI report named Report1 that uses the model. Report1 contains visuals on multiple pages.
You need to reduce the query execution time for the visuals on all the pages.
What are two features that you can use? Each correct answer presents a complete solution.
NOTE: Each correct answer is worth one point.
A.user-defined aggregationsCorrect
B.automatic aggregationCorrect
C.query caching
D.OneLake integration
Explanation
User-defined aggregations and automatic aggregations both add in-memory aggregation tables on top of DirectQuery tables, so summarized visuals on every page are answered from the cache instead of querying the 500-million-row source. Query caching applies only to Import semantic models and only caches the initial landing page of a report, so it neither works for DirectQuery nor covers all pages. OneLake integration writes Import tables to Delta tables in OneLake and does not speed up DirectQuery visuals.
You have a Fabric tenant that contains 30 CSV files in OneLake. The files are updated daily.
You create a Microsoft Power BI semantic model named Model1 that uses the CSV files as a data source. You configure incremental refresh for Model1 and publish the model to a Premium capacity in the Fabric tenant.
When you initiate a refresh of Model1, the refresh fails after running out of resources.
What is a possible cause of the failure?
A.Query folding is occurring.
B.Only refresh complete days is selected.
C.XMLA Endpoint is set to Read Only.
D.Query folding is NOT occurring.Correct
E.The data type of the column used to partition the data has changed.
Explanation
Incremental refresh relies on the RangeStart/RangeEnd filter being pushed to the source. When query folding does not occur, the mashup engine retrieves all rows from the source and applies the filter locally, which can make the refresh run out of resources and defeats the purpose of incremental refresh. Query folding occurring is the desired behavior, Only refresh complete days just aligns the refresh window to whole days, and a read-only XMLA endpoint does not affect refreshes started in the service. A changed data type would cause an error rather than resource exhaustion.
You have a Fabric tenant that uses a Microsoft Power BI Premium capacity.
You need to enable scale-out for a semantic model.
What should you do first?
A.At the semantic model level, set Large dataset storage format to Off.
B.At the tenant level, set Create and use Metrics to Enabled.
C.At the semantic model level, set Large dataset storage format to On.Correct
D.At the tenant level, set Data Activator to Enabled.
Explanation
Semantic model scale-out requires the Large semantic model storage format setting to be enabled on the model; disabling it also disables scale-out. Turning the setting off does the opposite of what is needed. The Metrics and Data Activator tenant settings are unrelated to query scale-out read-only replicas.
You have a Fabric tenant that contains a warehouse. The warehouse uses row-level security (RLS).
You create a Direct Lake semantic model that uses the Delta tables and RLS of the warehouse.
When users interact with a report built from the model, which mode will be used by the DAX queries?
A.DirectQueryCorrect
B.Dual
C.Direct Lake
D.Import
Explanation
A Direct Lake model that uses the warehouse's SQL-based RLS is Direct Lake on the SQL analytics endpoint. When the SQL analytics endpoint enforces row-level security, Direct Lake cannot read the Delta tables directly, so DAX queries fall back to DirectQuery and the warehouse applies the security. This is the default Direct Lake behavior (Automatic); if fallback is disabled, the queries fail instead. Direct Lake mode itself is used only when the data can be loaded straight from the Delta tables. Dual and Import are storage modes for other model types and are not used here.
You have a Fabric tenant that contains a complex semantic model. The model is based on a star schema and contains many tables, including a fact table named Sales.
You need to create a diagram of the model. The diagram must contain only the Sales table and related tables.
What should you use from Microsoft Power BI Desktop?
A.data categories
B.Data view
C.Model viewCorrect
D.DAX query view
Explanation
Model view lets you create additional diagram layouts and add only selected tables, for example by adding the Sales table and then its related tables, so the diagram shows a subset of a large model. Data view shows table rows, DAX query view runs DAX queries, and data categories only tag columns (such as geographic data); none of them produce a model diagram.
You have a Fabric tenant that contains a semantic model. The model uses Direct Lake mode.
You suspect that some DAX queries load unnecessary columns into memory.
You need to identify the frequently used columns that are loaded into memory.
What are two ways to achieve the goal? Each correct answer presents a complete solution.
NOTE: Each correct answer is worth one point.
A.Use the Analyze in Excel feature.
B.Use the Vertipaq Analyzer tool.Correct
C.Query the $System.DISCOVER_STORAGE_TABLE_COLUMN_SEGMENTS dynamic management view (DMV).Correct
D.Query the DISCOVER_MEMORYGRANT dynamic management view (DMV).
Explanation
Direct Lake loads (transcodes) whole columns into memory on demand, and the DISCOVER_STORAGE_TABLE_COLUMN_SEGMENTS DMV reports for each column segment whether it is resident and its temperature, which shows how frequently it is used. VertiPaq Analyzer reads the same storage DMVs and presents residency and temperature per column. Analyze in Excel only queries the model, and DISCOVER_MEMORYGRANT reports memory grants for queries, not which columns are loaded.
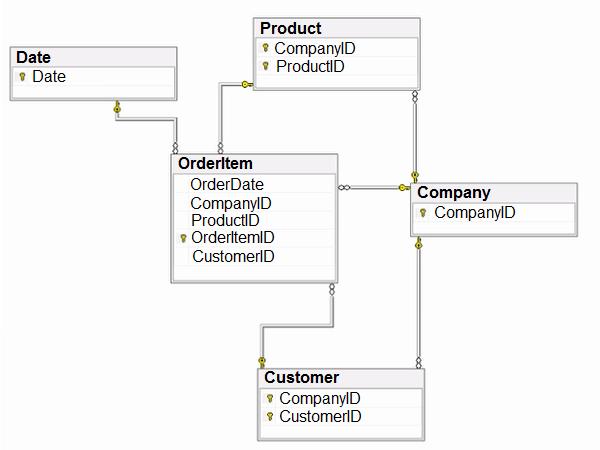
You have the source data model shown in the following exhibit.
The primary keys of the tables are indicated by a key symbol beside the columns involved in each key.
You need to create a dimensional data model that will enable the analysis of order items by date, product, and customer.
What should you include in the solution? To answer, select the appropriate options in the answer area.
NOTE: Each correct selection is worth one point.
Explanation
The Product table's primary key is composite (CompanyID and ProductID), so ProductID by itself is not unique and cannot serve as the one side of the relationship. A Power BI model relationship relates a single column to a single column, so you cannot base it on both columns directly; instead you create one key that combines CompanyID and ProductID (a surrogate key) in both the Product dimension and the OrderItem fact table and relate on it. The Company entity contains only CompanyID, which is already carried in the Product and Customer keys, and the analysis is required only by date, product, and customer, so Company adds no attributes worth denormalizing and can be omitted from the dimensional model.
You have a Fabric tenant that contains a semantic model named Model1. Model1 uses Import mode. Model1 contains a table named Orders. Orders has 100 million rows and the following fields.
| Name | Data type | Description |
|---|---|---|
| OrderID | Integer | Column imported from the source |
| OrderDateTime | Date/Time | Column imported from the source |
| Quantity | Integer | Column imported from the source |
| Price | Decimal | Column imported from the source |
| TotalSalesAmount | Decimal | Calculated column that multiplies Quantity and Price |
| TotalQuantity | Integer | Measure |
You need to reduce the memory used by Model1 and the time it takes to refresh the model.
Which two actions should you perform? Each correct answer presents part of the solution.
NOTE: Each correct answer is worth one point.
A.Split OrderDateTime into separate date and time columns.Correct
B.Replace TotalQuantity with a calculated column.
C.Convert Quantity into the Text data type.
D.Replace TotalSalesAmount with a measure.Correct
Explanation
A Date/Time column with 100 million rows has very high cardinality; splitting it into separate date and time columns produces two low-cardinality columns that compress far better in VertiPaq. TotalSalesAmount is a calculated column, so it is computed during every refresh and stored for all 100 million rows; replacing it with a measure (for example SUMX over Quantity times Price) removes that storage and refresh work. Turning the TotalQuantity measure into a calculated column would add memory, and converting Quantity to Text would increase size and break aggregation.
You have a Fabric tenant that contains a semantic model.
You need to prevent report creators from populating visuals by using implicit measures.
What are two tools that you can use to achieve the goal? Each correct answer presents a complete solution.
NOTE: Each correct answer is worth one point.
A.Microsoft Power BI DesktopCorrect
B.Tabular EditorCorrect
C.Microsoft SQL Server Management Studio (SSMS)
D.DAX Studio
Explanation
Implicit measures are blocked by setting the model's Discourage implicit measures (DiscourageImplicitMeasures) property to true. Power BI Desktop exposes this property in the model's properties pane in Model view, and Tabular Editor can set it on the Model object through the XMLA endpoint or a .pbip/.bim file. DAX Studio is a query and performance-analysis tool that does not edit model properties, and SSMS does not offer this model property in its designer, so neither is the intended tool.
Verifying access...
Access Required
You need to purchase this exam to access practice mode
Unlock a few more questions every day for 300 points you earn free on
Godlike Academy. Everything you unlock with the Daily Climb stays open for 7 days after your last unlock.